After preparing the Four-Year Report, which starts with data on 3,846 law departments, for this blog post we took a look at one particular metric: total legal spend as a percentage of revenue (TLS). To keep the companies in this mini-analysis somewhat more comparable, we narrowed that group to US participants.
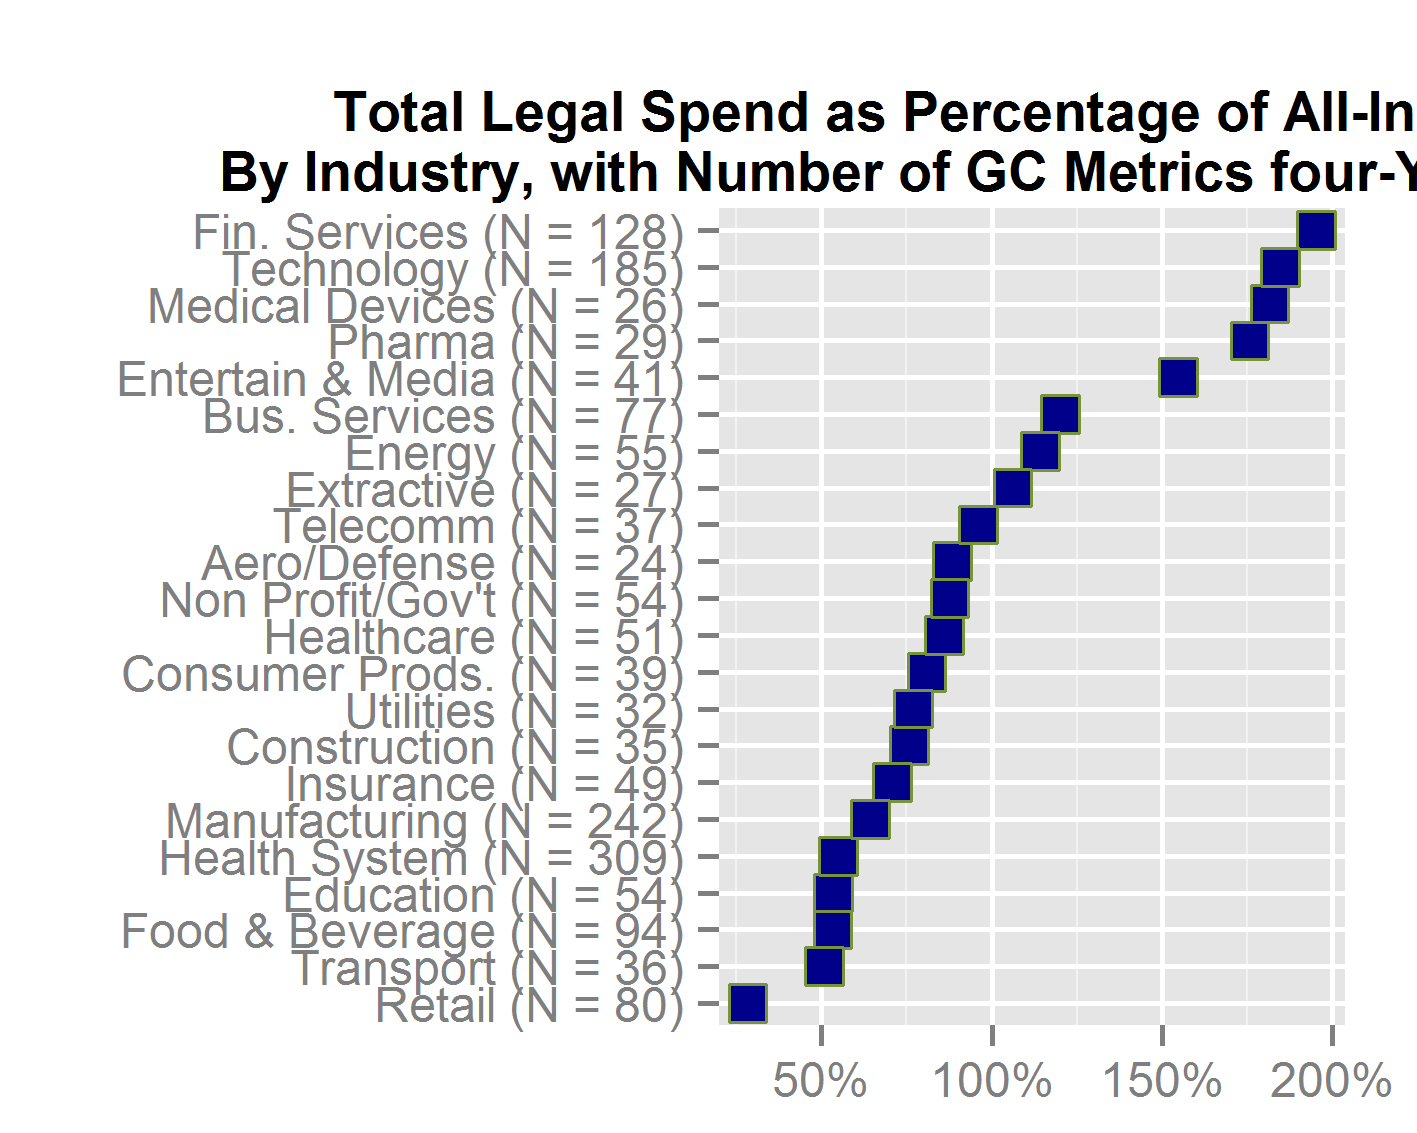
The chart below took the median TLS of each industry and divided it by the average TLS for all the companies. With that calculation, you can see which industries had medians that significantly exceeded the average (Financial Services and Technology) along with those that fell significantly below (Retail and Transport). Industries near 100% on the bottom axis were right about average in TLS (e.g., Telecomm and Extractive). As could have been predicted, a highly regulated industry tops the chart, followed by several that have large patent investments. But this correlation does not hold throughout.
The number in parenthesis after the industry names tells how many companies are covered.