Published on:

In full-page ads, Bottomline Technologies proclaims that “Bottomline is chosen 3X more than any other legal spend management vendor.” Being inquisitive about law department metrics, I visited the web page the ad says lets you “Find out why” – www.bottomline.com/3x.

Don’t get your hopes up. The page suggests that more than 180 companies with claims functions have licensed software from Bottomline. It then gives “the top 3 reasons why they chose Bottomline.” Ok, maybe those are the reasons why they chose the company’s software. But that does not explain why companies choosing among software offerings similar to Bottomline’s for legal spend management select Bottomline three times more frequently than they select the competition. Or perhaps I misread the quoted statement in the first sentence.

A quick Google search turned up nothing about the ad’s statement. My crude understanding of advertising law is that if you assert something about your product or service, someone can challenge you to back up that assertion. “WonderProduct cleans three times faster” trumpeted in an advertisement creates a legal obligation on the part of the manufacturer to have sufficient factual support. Even if the preceding two sentences don’t capture the nuances of our laws and regulations, it still seems to me that Bottomline should explain the basis for its 3X claim

Published on:

I was interested how many times certain law departments show up in Google search results. When I searched “Google law department”, Google returned what it determined are the top 10 web pages for that search. At the top of the first page, in modest grey font, it said “Page 1 of 4,060 results (0.16 seconds)”. In fact, those “results” merely estimated the total number of “hits” the search would have found had the search engine carefully scoured what had been indexed on the Web. Those are not actual hits.

Moreover, the grey results number drops as you call up subsequent pages of 10 results each. The second page showed 4,050 results, while the third and final page showed 25 results. Eventually the results estimate stabilizes as on this search it did at 25. My second search, for “Microsoft law department”, started at 242 results but that estimate shrank to 37 by the fifth and final page.

Out of curiosity, I ran identical searches on Bing. The Google search returned 15 on the last of two pages while the Microsoft search returned 22 on the second page. I do not know why Google stabilized at more than twice as many results for Google and 60% higher for Microsoft.

Published on:

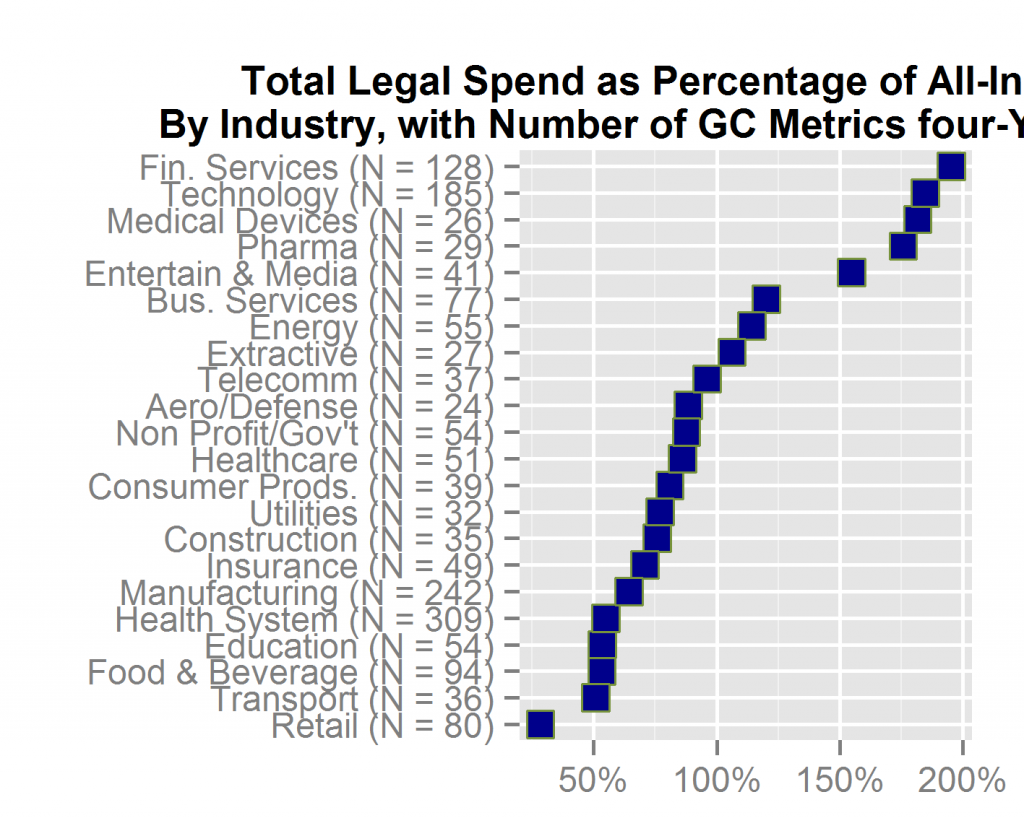
After preparing the Four-Year Report, which starts with data on 3,846 law departments, for this blog post we took a look at one particular metric: total legal spend as a percentage of revenue (TLS). To keep the companies in this mini-analysis somewhat more comparable, we narrowed that group to US participants.

The chart below took the median TLS of each industry and divided it by the average TLS for all the companies. With that calculation, you can see which industries had medians that significantly exceeded the average (Financial Services and Technology) along with those that fell significantly below (Retail and Transport). Industries near 100% on the bottom axis were right about average in TLS (e.g., Telecomm and Extractive). As could have been predicted, a highly regulated industry tops the chart, followed by several that have large patent investments. But this correlation does not hold throughout.

The number in parenthesis after the industry names tells how many companies are covered.june172014indratio


Published on:

I am deeply invested in this topic, but I am struggling. And, this is a huge topic that deserves multiple thoughtful posts. But I will stick my toe into the water because of a piece in MIT Tech. Rev., May/June 2014 at 10.   A professor of political science and computer science at Northwestern University, David Lazer, wrote about methodological shortcomings of data analysis.

One lesson Lazer draws is that “methods and data should be more open.” Applied to the world of data that managers of lawyers would like, it means that those who collect legal management data and publish results should explain how they collected it, what pre-processing they did (meaning, how did they clean the data before they ran their analyses), and what limitations they are aware of in their methodology.

Unfortunately, those of us not in academia who arduously and expensively gather hard-to-get data do so ultimately in order to make money. Vendors, consultants, publisher and trade groups are not eleemosynary institutions. We don’t want to give away our blood, sweat and metrics, let alone expose to the critical world all the trade-offs, data messes, and tough decisions we made regarding that data. Yet, if we are not more open about our efforts, others can’t help us improve. Nor can they reuse the data for other purposes or complement the data with related metrics. Proprietary data stunts progress.

Published on:

A post on LDO Buzz back in April reprinted an article originally published in InsideCounsel. They article covers the usual points regarding what benchmark data to consider, what drives those metrics, and some steps to take to address problems. Nothing new, nothing objectionable.

One line, however, missed a key point: “High outside counsel spending as a percent of revenues compared to peers and/or increasing spending levels over time indicates (sic) the need to more effectively manage outside counsel.”

True, if your outside counsel spend has run at 0.25 percent of revenue for several years (or is increasing) while your industry’s median is 0.20 percent, you should take a look at how you use outside counsel. But, you might also look at whether your internal staff is adequate, because with too few lawyers, paralegals or other support staff your department might resort to external counsel more than would be necessary with the right talent. Further, you might look at how clients use the law department, since if they ask for services that consume too much time or inappropriate services, there will be more need for outside counsel.

Published on:

When something increases the same fraction or percentage, rather than the same amount, during each period of time, the numerically savvy call it exponential growth. It would almost certainly be inaccurate for a general counsel to announce that outside counsel spending by her department, for example, has grown exponentially for a period of years. It might have doubled from one year to the next but it is highly unlikely that it doubled once again the next year let alone doubled also in the most recent year. Too many people use “exponential” as an adjective when they really mean “dramatic”.

Had the general counsel’s spend been $1 million in year one, an exponential doubling would see $2 million in year two, $4 million in year three, and $8 million in year four. That level of explosive growth can only happen for a short time and starting from a small base. This comment arose from Samuel Arbesman, The Half-Life of Facts: Why Everything We Know Has an Expiration Date (Current 2012).

Published on:

Rick Klau has spent most of his professional life with Internet startups. Now with Google Ventures, Klau keynoted this year’s ABA Techshow. The ABA Journal, June 2014 at 37, summarized three lessons Klau offered for the legal industry.

His first lesson “emphasized the importance of using data to make decisions.” Klau argued that “facts and figures are exponentially more important than gut feelings and informed opinions.”

This blogger agrees, completely. Whether a decision concerns the choice of counsel for a matter, the promotion of a lawyer, the selection of a matter management system, the maintenance of a patent, the client satisfaction initiatives to undertake, or other calls, data is available or can be collected that informs thinking. No, algorithms can’t replace experience and thinking, but data analysis significantly strengthens the quality of decisions by managers of lawyers. Even if data simply challenges commonly-held assumptions, that helps. Numbers help people make better decisions.

Published on:

When they create a graphical plot, most people unthinkingly use the default axis linest. The axis lines on the typical scatter-plot or bar plot are the rectangle of lines around the plot data – the points or columns. Outside the axis lines are the tick marks, labels, text, and legends. Most people think of the horizontal X-axis on the bottom of the plot and the vertical Y-axis on the left, but there are also the top and right-side axis lines.

Using data from the General Counsel Metrics 2010 benchmark survey, the four plots below show different styles of X and Y axis lines. The first is plain vanilla: a black line around the data plotting area. The plot below it chooses a dashed line that is thicker than the default line size. The third plot introduces color, blue, while the final plot removes the left and bottom axis lines (X and Y).

My preference leans toward minimalism. Shun colored, thick, dashed and like options for axis lines because they distract the reader from the actual data being presented. Default black lines are comfortable to readers, but I still favor no lines at all.

Published on:

Andy Kraftsow wrote a piece for Inside Counsel (February 21, 2014).  He explained the mathematics of the Poisson distribution to show in discovery how to dramatically reduce the number of documents that need to be reviewed to understand what they say about the issues.

Most of the piece explains the iterative process of requesting documents and categorizing them by keywords and phrases into what Kraftsow calls an “organizational schema.”

He then highlights the advantage of a Poisson calculation. “Assume that the organizational schema consists of 50 categories and that each category has been populated with 2,000 documents. Do you need to read all 100,000 documents to understand what the collection says about each of the 50 issues? Poisson says “no.” You need only read 15,000.”

Published on:

An API, which is an acronym for application program interface, is software that lets programmers work with a program, such as to extract information from on online site. Many APIs are available for specific websites. For example, Amazon or eBay APIs allow developers to use their platform to create specialized web stores.

To search Twitter, for example, and find out how many tweets there have been about a particular general counsel, you have to be authorized to use the Twitter API. That step takes a bit of work, but you eventually receive a personalized set of access codes (called keys).

Once you have API access, you can search and retrieve. Using the data returned, you can turn to other software to analyze the frequency, volume, and content of the tweets. In our world that is dense with online information, some facility with APIs will be crucial for those who want to harvest that trove.